The Edsby Gradebook, also referred to by some teachers as a mark book, enables teachers to turn on a wide range of summary columns. This provides teachers with great flexibility in how they can view assessment data they’ve captured, and how that can be shared with students and parents.
To access the Gradebook Summary Columns setup screen, click on the gear icon in the upper right corner of the Gradebook. Select Gradebook Setup from the drop-down menu.

The Gradebook Setup form provides the teacher with a flexible way of choosing the additional summary columns they would like to see in their Gradebook. In addition to the Average as a percent, teachers can add:
- Mode – most common number in a data set
- Median – middle of the set of numbers
- Latest – the last entry for a outcome
- Highest – the highest value
- Decaying Average – a weighted moving average where more recent data is given greater weight
- Range – the lowest and highest numbers
- Count – the number of non-blank assessments
- Standard Deviation – a way of describing the variability or spread in a set of data
The teacher can also choose how the summary method is shown in the gradebook:
- Percent
- Four Level
- Four Level +/-
- Letter Grade
- EGSN
- Levels EMBN
- Traffic Lights
- Proficiency Scale
Note: the Show As list may differ based on your organization’s assessment practices.
Additionally, teachers can choose to add columns for individual strands or categories of knowledge.
Teachers can check the “Show to Students” checkbox if they wish to have the values of a particular column made available to each student and their parents via My Work and their Edsby Progress Report.
Complete the form and save. The columns can be reordered by grabbing the hamburger icon and dragging to reorder. Click x to Remove a Column, if desired.
Strand Examples
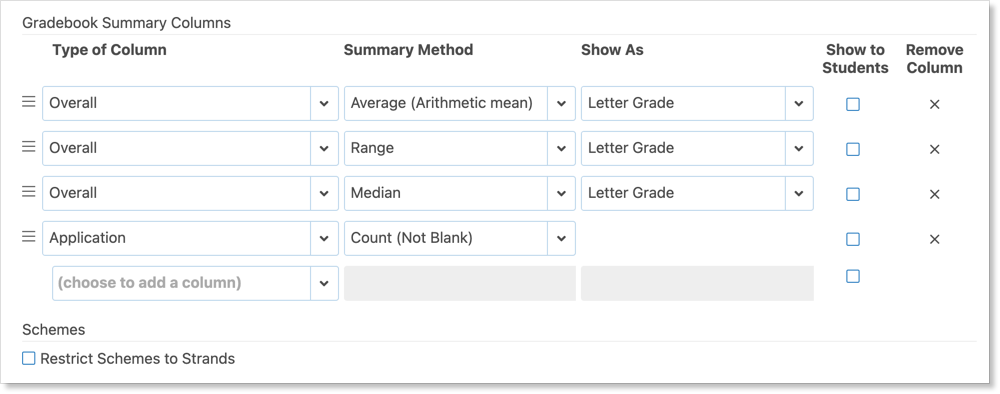
Ms. Ateeq teaches 6th grade Science and she predominantly uses the letter grade scheme. In this Science class, the teacher wants to see the Overall Averages as a Letter Grade, the range of letter grades, and the median.
Note that Ms. Ateeq sometimes use the 4 Level and the EGSN scheme. Your organization tells Edsby the value of symbolic grading scheme. When teachers enter an A-, Edsby also stores the percentage value. The same would apply for EGSN, 4 Level, and any other summative symbolic grading scheme.
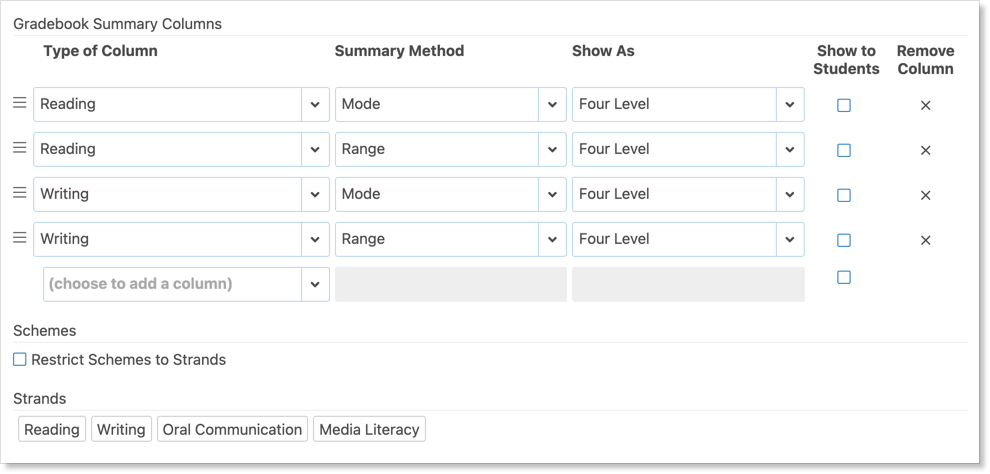
Mr. Chowdhury teaches 2nd grade, and he predominantly uses a 4-level grade scheme. In his Language class, he wants to see the mode and range for both Reading and Writing.
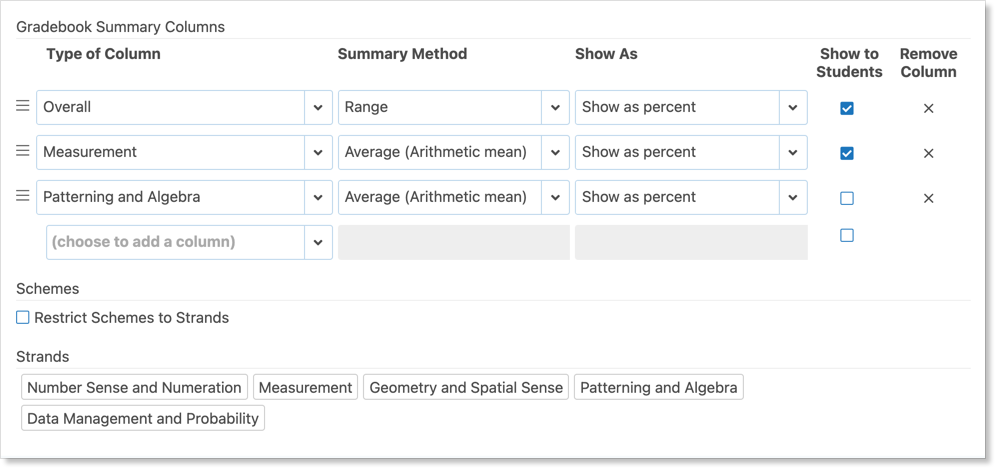
In this example, Madison Brant wishes to summarize each student’s range of overall performance in Mathematics, as well as their average performance in the Measurement and Patterning and Algebra strands. Additionally, she would like to share these summaries with students and their parents. She will set up her Gradebook Summary Columns as the following:
When Tegan Lee, a student of Madison Brant’s, opens My Work, these summaries will be visible in the Perspective tab.
Global Level Outcomes Example
Mrs. Gruenspan assesses learning based on outcomes. For example, students are evaluated on their availability to solve one and two-step linear equations involving whole numbers. In the following illustration, the students have been assessed on P.73 & P.74 in two assessments. The summary columns display the latest entry for each Outcome.
The Latest value is not based on the assessment date but on the last grade entry date, so that anytime a teacher adds a grade for a specific Outcome, the Latest value will be displayed in the Summary Column.
Decaying Average
Decaying average is most suitable for assessment when teachers want to place more weight on recently scored materials, thereby rewarding students’ progress without penalizing them for their starting point. This method considers the most recent scores as more representative of a student’s current mastery level and puts more emphasis on those scores compared to older ones. Assessment practices that emphasize outcomes-based learning and track student progress throughout the term, rather than one overall grade, find decaying average to be a suitable grading approach.
Teachers have the option of using a decaying average in the gradebook or viewing the decaying average in the Perspective Analyze and the report card sheet’s Graph view.
The Class Setup form includes an option to set the weight of the most recent score. The default setting is 65%. The option will apply to Perspective Analyze and the report card’s Graph view but has no impact on Gradebook calculations unless a summary column is added to the Gradebook.
Example
Student A has been assessed on outcome A.1. four times during the term. The student’s grades are:
| Score | Mean Average | Decaying Average | Calculation | |
| 1 | 58% | 58% | 58% | 58 * 100% = 58 |
| 2 | 65% | 61.5% | 62.6% | (58 * 35%) + (65 * 65%) = 62.6 |
| 3 | 80% | 67.7% | 73.9% | (62.6 * 35%) + (80 * 65%) = 73.9 |
| 4 | 80% | 70.8% | 77.9% | (73.9 * 35%) + (80 * 65% = 77.9 |
The gradebook summary columns display averages to one decimal place. The decaying average does not take the assessment weight into account.
The benefit of using a decaying average for this student is that it provides a more accurate reflection of their current performance by giving more weight to recent assessments. For instance, with a decaying average, the student’s grade improves from 70.75% to 77.86% after their most recent assessment, showing their progress more effectively compared to a traditional mean average.
With symbolic grades schemes such as 4 levels, the decaying average will be based on the percentage equivalent as defined in the grade mapping scheme.


